Core Web Vitals in 2026 — every threshold, one table.
LCP, INP, CLS: the official thresholds, the 75th-percentile rule, lab vs. field data, and the most common causes per metric — the reference sheet to link to, as of June 2026.
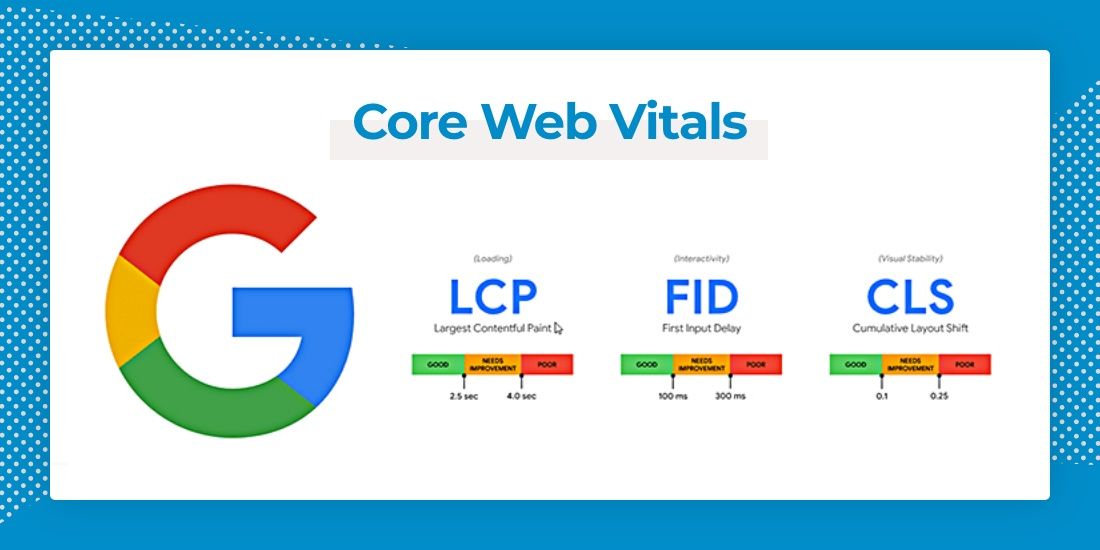
The Core Web Vitals are three user-experience metrics defined by Google: LCP (main-content load time, good ≤ 2.5 s), INP (responsiveness to input, good ≤ 200 ms) and CLS (visual stability, good ≤ 0.1). A page passes when at least 75% of real visits reach the “good” range — assessed per metric, mobile and desktop separately. As of June 2026, these thresholds are unchanged.
This post is built as a reference sheet: all the numbers, the measurement rules, the most common causes per metric. To link, to forward, to look up.
The thresholds (as of June 2026)
| Metric | Measures | Good | Needs improvement | Poor |
|---|---|---|---|---|
| LCP — Largest Contentful Paint | until the largest content element is visible | ≤ 2.5 s | 2.5 – 4.0 s | > 4.0 s |
| INP — Interaction to Next Paint | response to clicks, taps, keyboard (whole page lifetime) | ≤ 200 ms | 200 – 500 ms | > 500 ms |
| CLS — Cumulative Layout Shift | unexpected layout jumps (unitless score) | ≤ 0.1 | 0.1 – 0.25 | > 0.25 |
Plus two supporting metrics that are not Core Web Vitals but carry the diagnosis: TTFB (server response time, good orientation ≤ 0.8 s) and FCP (first visible content, good ≤ 1.8 s). A poor LCP almost always starts with a poor TTFB.
One watershed for reading older sources: since 12 March 2024, INP is the official third metric, replacing FID (First Input Delay). Any text still recommending FID values has been outdated since then — INP is considerably stricter, because it measures every interaction across the whole session, not just the delay of the first one.
The three measurement rules audits trip over
1. The 75th-percentile rule. Google assesses the 75th percentile of real visits: a page passes a metric when at least three quarters of views land in the green range. The average is irrelevant — a good mean can hide a quarter of catastrophic visits.
2. Field data beats lab data. What counts are measurements from real Chrome users (the CrUX dataset, visible in PageSpeed Insights and Search Console’s Core Web Vitals report). Lighthouse is a lab test on a simulated mid-range mobile device — indispensable for diagnosis, but not the report card. Which also means: your own desktop browser with a warm cache is worthless as a measuring instrument.
3. Mobile and desktop are assessed separately. Passing on desktop says nothing about mobile — and mobile is the bottleneck: simulated throttling in the lab, real radio connections in the field, weaker devices. If you check only one number, check the mobile one.
Why the thresholds matter — the honest framing
Core Web Vitals are part of Google’s page-experience assessment and feed into ranking — but they are one signal among many, not a sole decider. The honest formula: good values don’t win a ranking; bad values lose one. With comparable content relevance, experience decides the tiebreak — and below the thresholds, every additional second measurably costs conversions: the SXO part of the equation, which holds even without Google. For AI crawlers with limited reading budgets the same argument applies once more: fast, static pages get read preferentially — the GEO part of the equation.
Diagnosis: the most common causes per metric
| Metric | Most common causes | The structural fix |
|---|---|---|
| LCP | slow server (TTFB), render-blocking CSS/JS, unoptimised hero images, external font CDNs | pre-rendered HTML from the edge, modern images (WebP/AVIF) with dimensions, self-hosted fonts |
| INP | JavaScript main-thread blocking: plugin layers, whole-page hydration, third-party tags | ship less JS: static HTML, interactivity only where needed, prune the tags |
| CLS | images without dimensions, late-loading banners/embeds, font reflow (FOUT without a swap strategy) | fixed dimensions for everything late-loading, font-display: swap with tuned fallbacks, no layout injections |
The pattern behind all three columns: poor values are rarely an “optimisation problem” and usually an architecture problem. A stack that renders pages at runtime from a database through plugin layers fights its own construction — which is why our new builds and migrations on Astro + Vercel clear the thresholds not by tuning but by design: pre-rendered HTML, mobile load under one second, Lighthouse scores of 95–100 as the normal state. Our internal budget deliberately sits below the official thresholds: LCP < 1.0 s, INP < 200 ms, CLS < 0.05.
How to measure properly — in this order
- Our free performance audit — real PageSpeed Insights data for any URL, in seconds, no signup.
- Search Console → Core Web Vitals — the field report across all pages of your domain, grouped by problem type. This is the view Google grades.
- Lighthouse / PageSpeed Insights — the lab diagnosis per page, when you need to know why a value is poor.
That’s why SEO216 builds on Astro and Vercel from the start — static HTML from the edge, sub-second LCP from day one, rather than clawing back slow scores later.
And once the diagnosis is in and the question “repair or rebuild?” is on the table: the full audit answers it with measurements, a competitor comparison and a prioritised plan — within 24 hours, free.